Back to Projects
Interactive data visualization platform for machine learning datasets with automated insights
Vue.js
Python
FastAPI
D3.js
TensorFlow
PostgreSQL
ML Data Visualizer
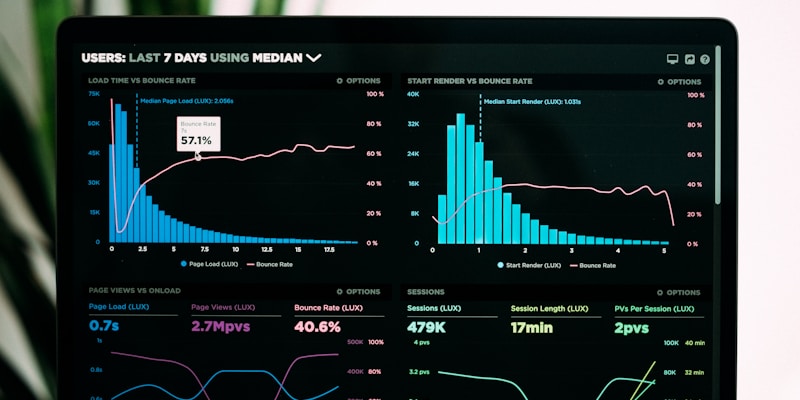
A comprehensive platform for visualizing and exploring machine learning datasets with automated insights and interactive charts.
Core Features
- Interactive Charts: Dynamic charts built with D3.js and Chart.js
- Automated Insights: AI-powered pattern recognition and anomaly detection
- Data Preprocessing: Built-in tools for cleaning and transforming data
- Model Comparison: Side-by-side comparison of ML model performance
- Export Capabilities: High-quality exports for presentations and reports
Technology Stack
- Frontend: Vue.js 3, TypeScript, D3.js
- Backend: Python, FastAPI, Pandas, NumPy
- ML Libraries: Scikit-learn, TensorFlow, PyTorch
- Database: PostgreSQL, InfluxDB
- Visualization: D3.js, Chart.js, Plotly
